
Meteors
7-day Trend
updated every 5 minutes
Spatial Distribution
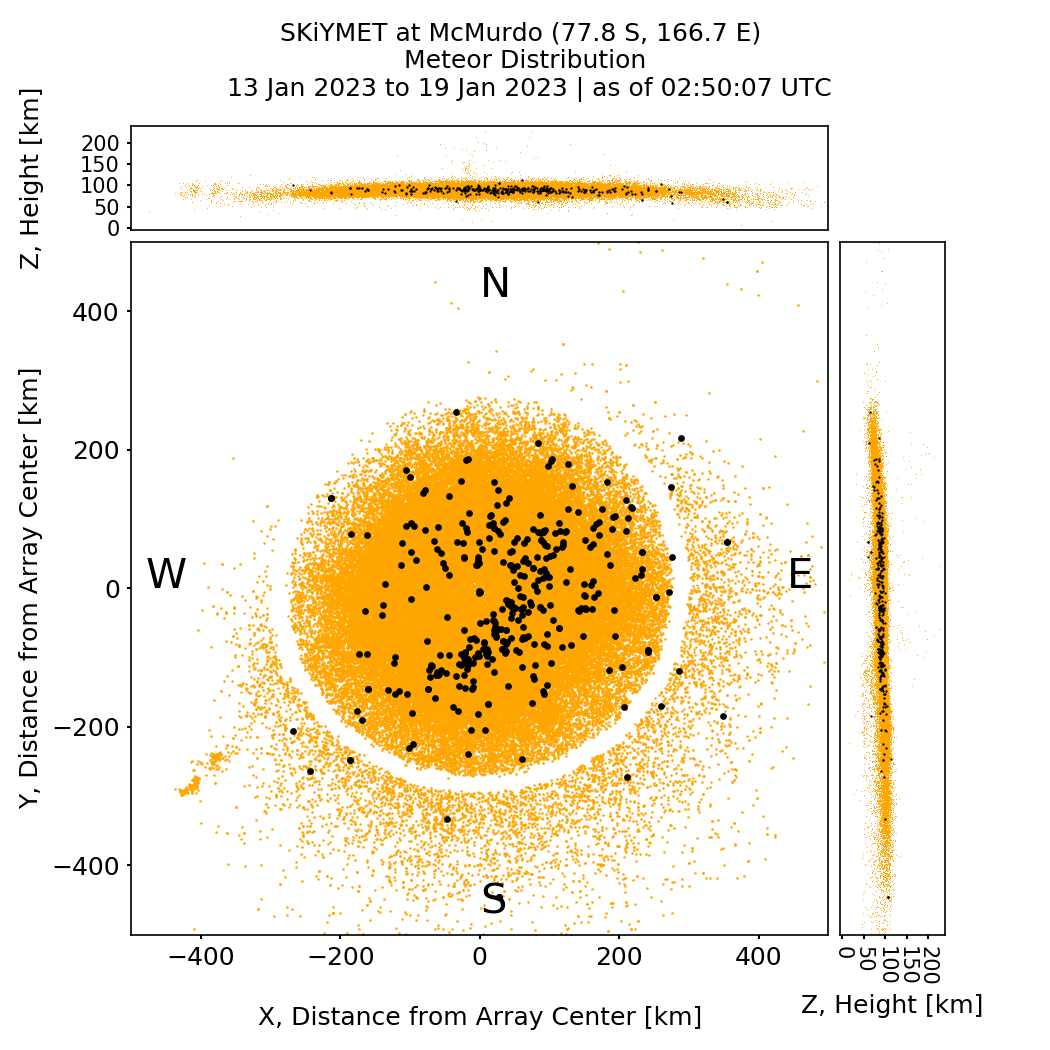
This graph shows a spatial distribution of detected meteors in the last 7 days. North refers to 'grid north' as defined for the Antarctic in the Universal Polar Stereographic (UPS) coordinate system. Meteors detected in the last 5 minutes are enlarged in black.
Temporal and Height Distribution
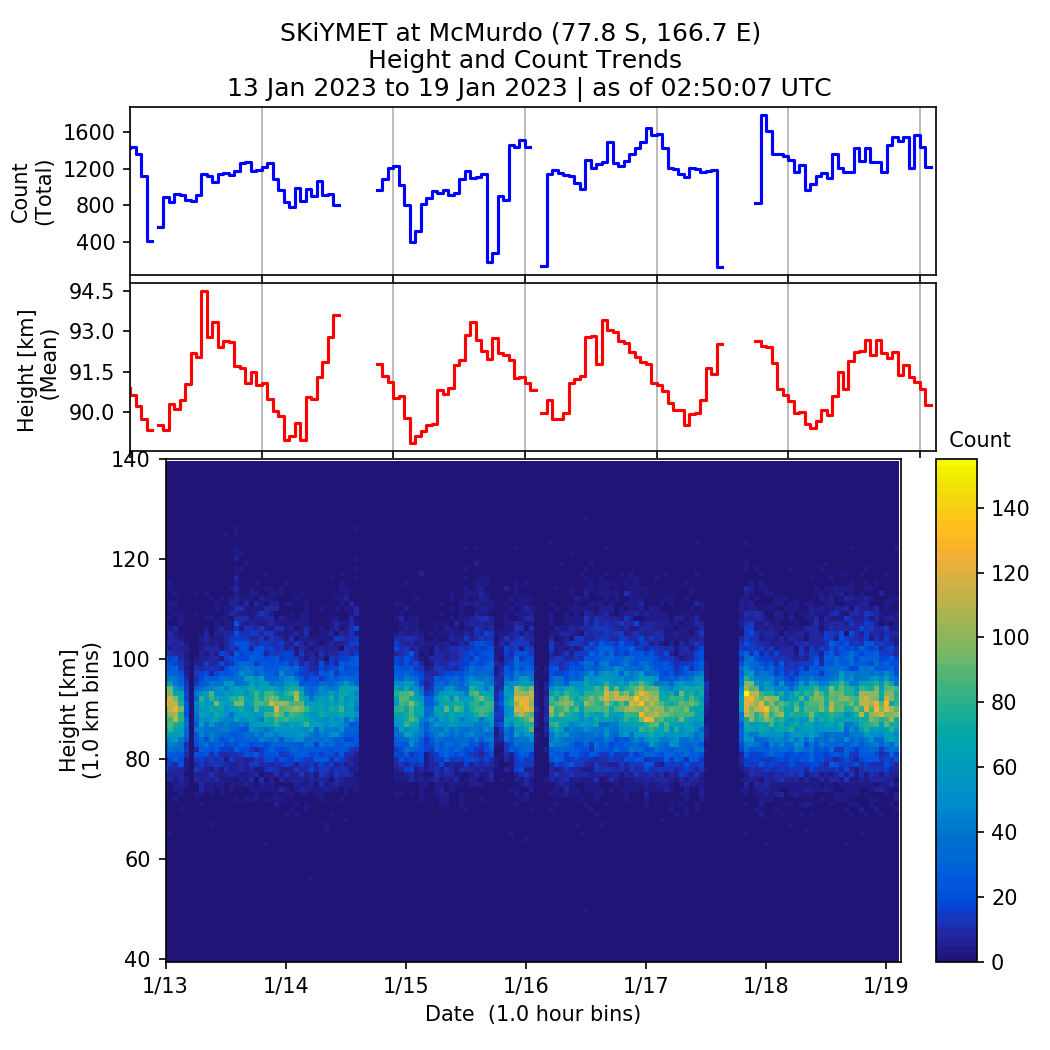
This graph shows a heatmap of detected meteor counts by height in the last 7 days. It also shows total hourly count and mean hourly meteor height. Data are grouped in 1 km and 1 hour bins.
