About the Sea Level Explorer
The Explorer
This tool was built as a way to quickly access and use satellite altimetry and tide gauge data for exploring sea level changes and measurement comparisons. It is developed at the University of Colorado Boulder by Mike Croteau in partnership with the University of Hawaii Sea Level Center and the Jet Propulsion Lab. It is under active development, but is usable today as a detailed tool for exploring sea level data.
Tide Gauge Details
Tide gauge data were obtained from the University of Hawaii Sea Level Center (UHSLC), which is one of the primary data centers in the Global Sea Level Observing System (GLOSS). The UHSLC offers tide gauge data with two levels of quality-control (QC), where more rigorous QC requires more effort and a greater time-lag. Research Quality (RQ) data receive thorough QC and are considered to be the final science-ready data set. This final QC process is time-consuming, and as a result, the RQ data are released 1-2 years after data is received from the data originators by the UHSLC. Fast Delivery (FD) data are released within 1-2 months of data collection and receive only basic QC focused on large level shifts and obvious outliers. FD data are replaced in the data stream by RQ data as the latter becomes available. The tide gauge sea level time series presented here are hybrid time series composed of RQ data when available with FD data appended to the end of each RQ series to create up-to-date records.
Read more and find links to UHSLC data here: https://uhslc.soest.hawaii.edu/datainfo/.
Altimetry Details
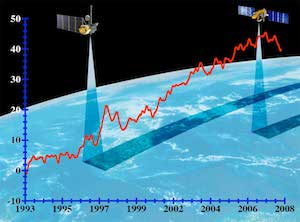
Altimetry data were obtained from the Jet Propulsion Lab's Physical Oceanography Distributed Active Archive Center (PODAAC). The PODAAC offers gridded altimetry measurements of Sea Surface Height Anomalies (SSHA) above a mean sea surface on 5-day increments at 1/6th degree resolution. Data is provided in near-real-time through an "interim" product and then refined through a final product with a time lag of a few weeks. The gridded altimetry product presented on this portal is a combination of these products, meaning that the most recent data points presented on this site are from that interim product. The gridded data are derived from the SSHA data of TOPEX/Poseidon, Jason-1, Jason-2 and Jason-3 as reference data from the level 2 swath data, plus ERS-1, ERS-2, Envisat, SARAL-AltiKa, CRyosat-2, depending on the date, from the RADS database. The gridding is done by the kriging method.
Additional information and data access is available here:
PODAAC: JPL MEaSUREs Gridded Sea Surface Height Anomalies Version 1812.
Acknowledgements and References
UHSLC Tide Gauges:
Caldwell, P. C., M. A. Merrfield, P. R. Thompson (2015), Sea level measured by tide gauges from global oceans — the Joint Archive for Sea Level holdings (NCEI Accession 0019568), Version 5.5, NOAA National Centers for Environmental Information, Dataset, doi:10.7289/V5V40S7W.
JPL SSHA Grids:
Zlotnicki, Victor; Qu, Zheng; Willis, Joshua. 2019. MEaSUREs Gridded Sea Surface Height Anomalies Version 1812. Ver. 1812. PO.DAAC, CA, USA. Dataset accessed 2020-04-03 at doi:10.5067/SLREF-CDRV2.

